I have had a few live elements on my website for years, for example my GitHub contribution graph or what I am currently listening to on Spotify. At some point I also added the current weather where I live, but I had always used some public API for that. Then I decided to fully build it myself.
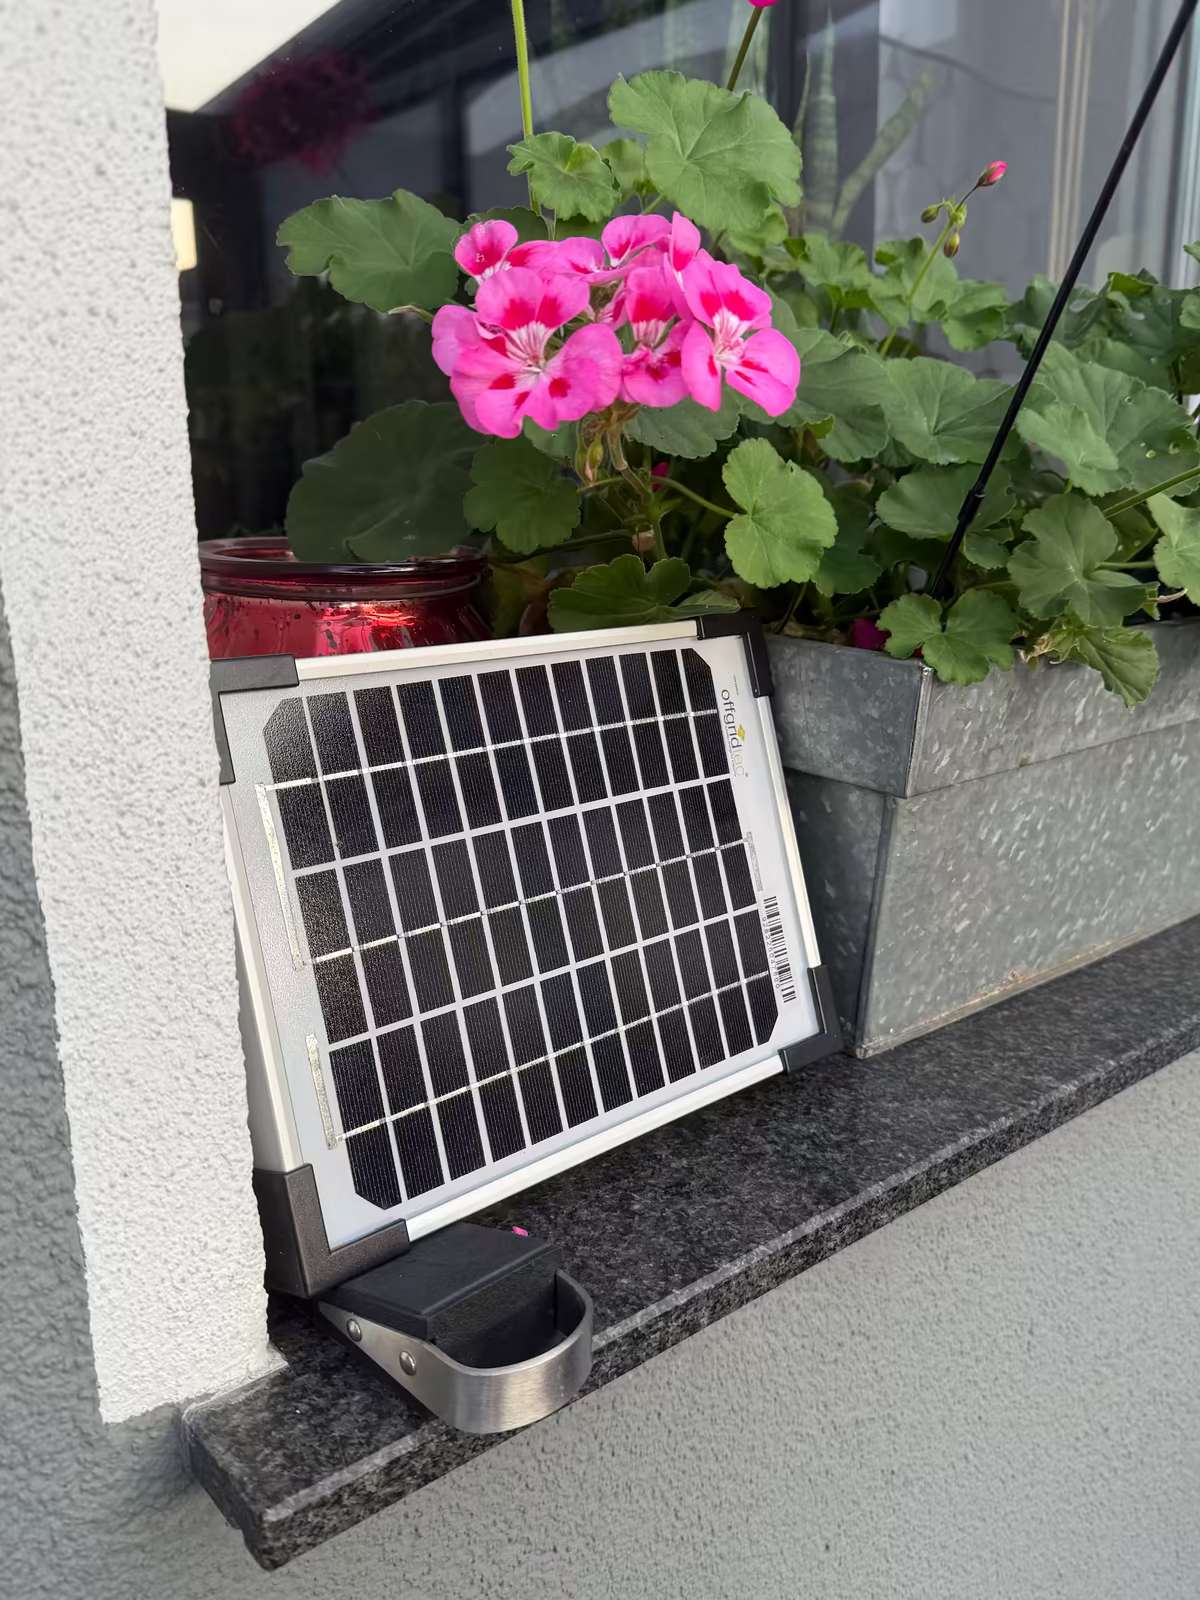
So now there is a small self-sustaining solar-powered weather station outside my window. At the time of writing, it has been online for 3 months without issue.
Hardware
The station is built around an ESP32-C3 and a few sensors connected over I2C:
- a SHT31 for temperature and humidity
- a BME280 for air pressure (and also temperature)
- a INA219 to keep track of the power coming from the solar panel
It is powered by a completely overspecced 5 W solar panel which is connected to a small solar+battery management board.
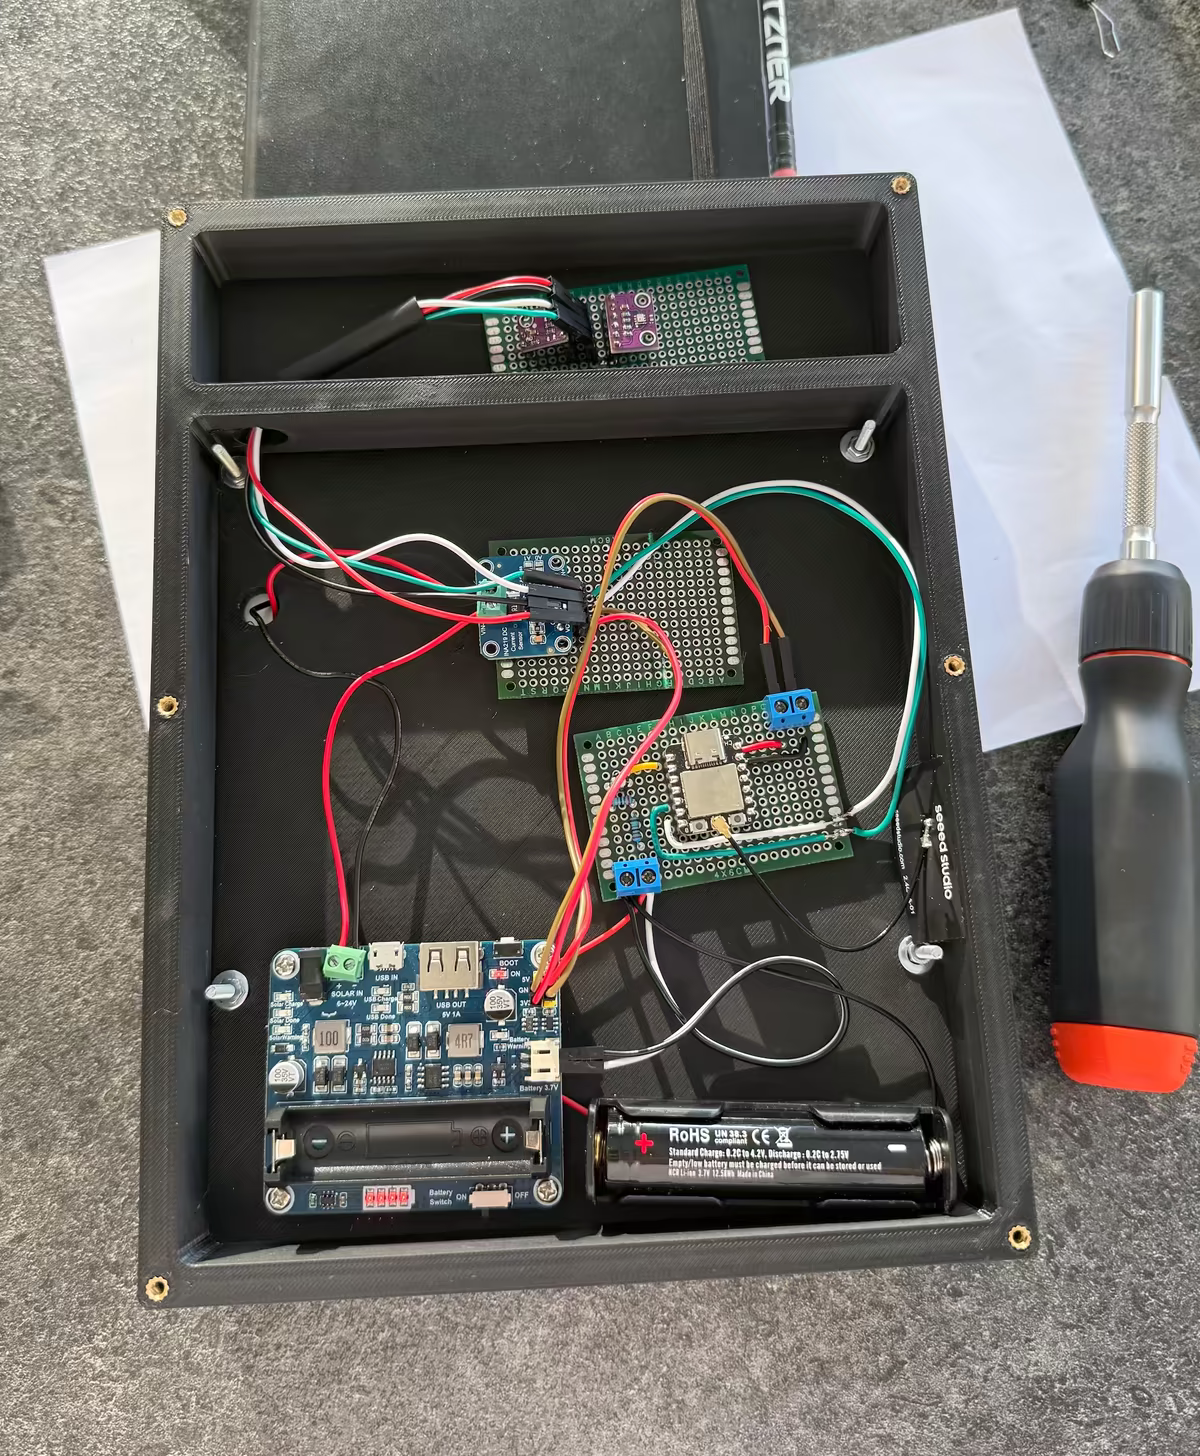
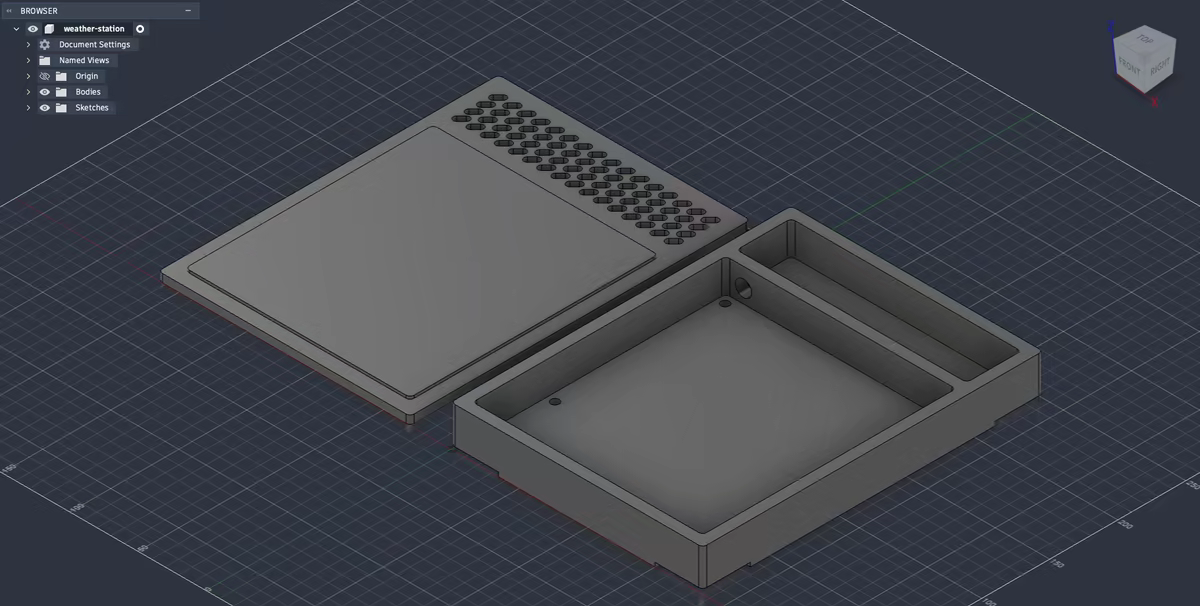
I designed the enclosure in Fusion and printed it myself. The sensors sit in a separate, vented section, away from the rest of the electronics which are sealed in an somewhat water-resistant enclosure.
Software
…is, of course, written in Rust, using the Embassy framework.
Most of the time, the ESP32 is in deep sleep to conserve power. Every few minutes it wakes up, connects to Wi-Fi and reads the sensors concurrently. Then it publishes the measurements to an MQTT broker and goes back to sleep.
How long it sleeps depends on the battery level. Above 50%, it reports every three minutes. Below that, the interval increases when the battery reaches the low end. In practice, the large solar panel has made power management fairly uneventful so far.
The rest of the system runs on my home server / NAS. Mosquitto receives the MQTT messages, Telegraf writes them into InfluxDB, and then I can see the data via Grafana. This website queries the same database through Cloudflare Workers VPC, so InfluxDB does not have to be exposed publicly.
This is all a bit overengineered for three weather metrics, but I already use Mosquitto and Grafana for other things.
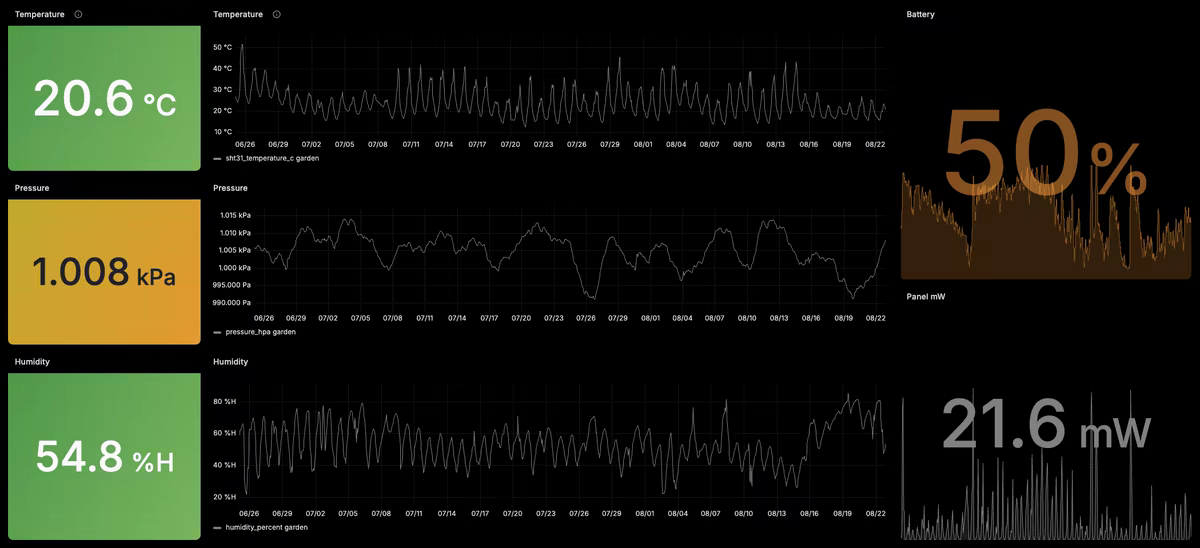
The public weather page currently only shows temperature, humidity, and pressure. Grafana also lets me inspect battery level and solar-panel output, which is useful for seeing whether the adaptive reporting interval is doing its job.